
Run bilingual instruments for families, students, and staff; watch climate data land in real time across six domains; and hand leadership the evidence they need, all in one FERPA-first platform.
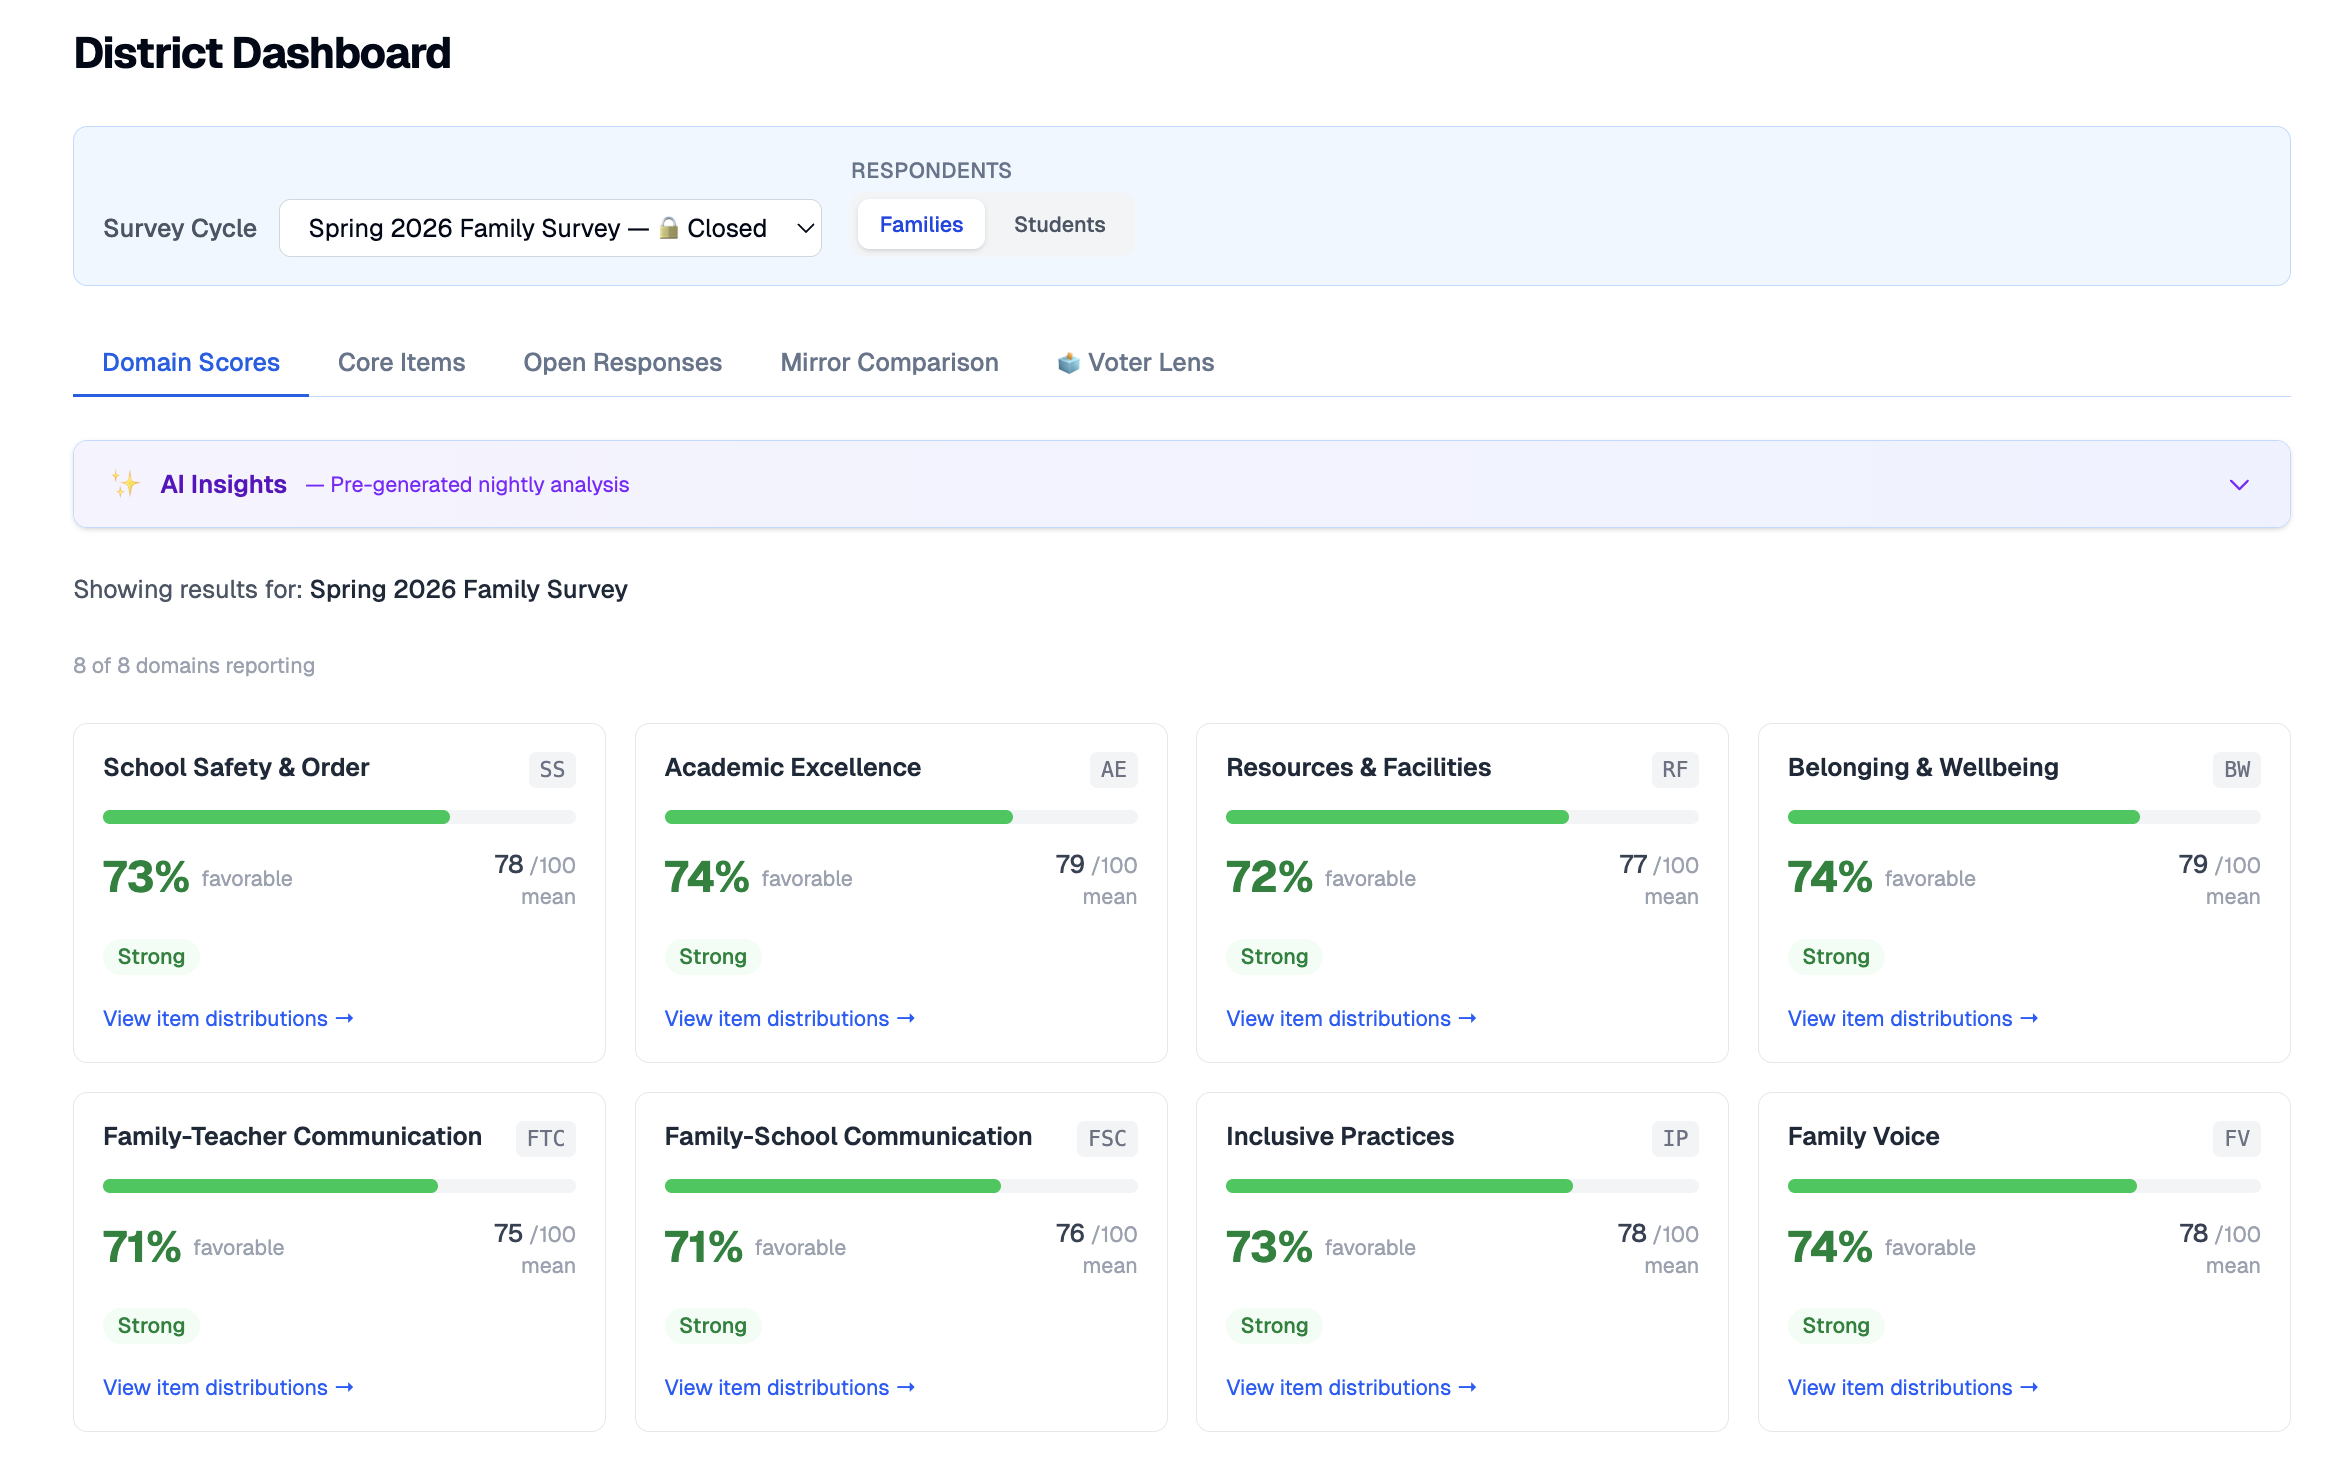
No exports, no waiting on a vendor. Administrators see favorability, mean score, and a strength band for every domain, the moment families and students respond.
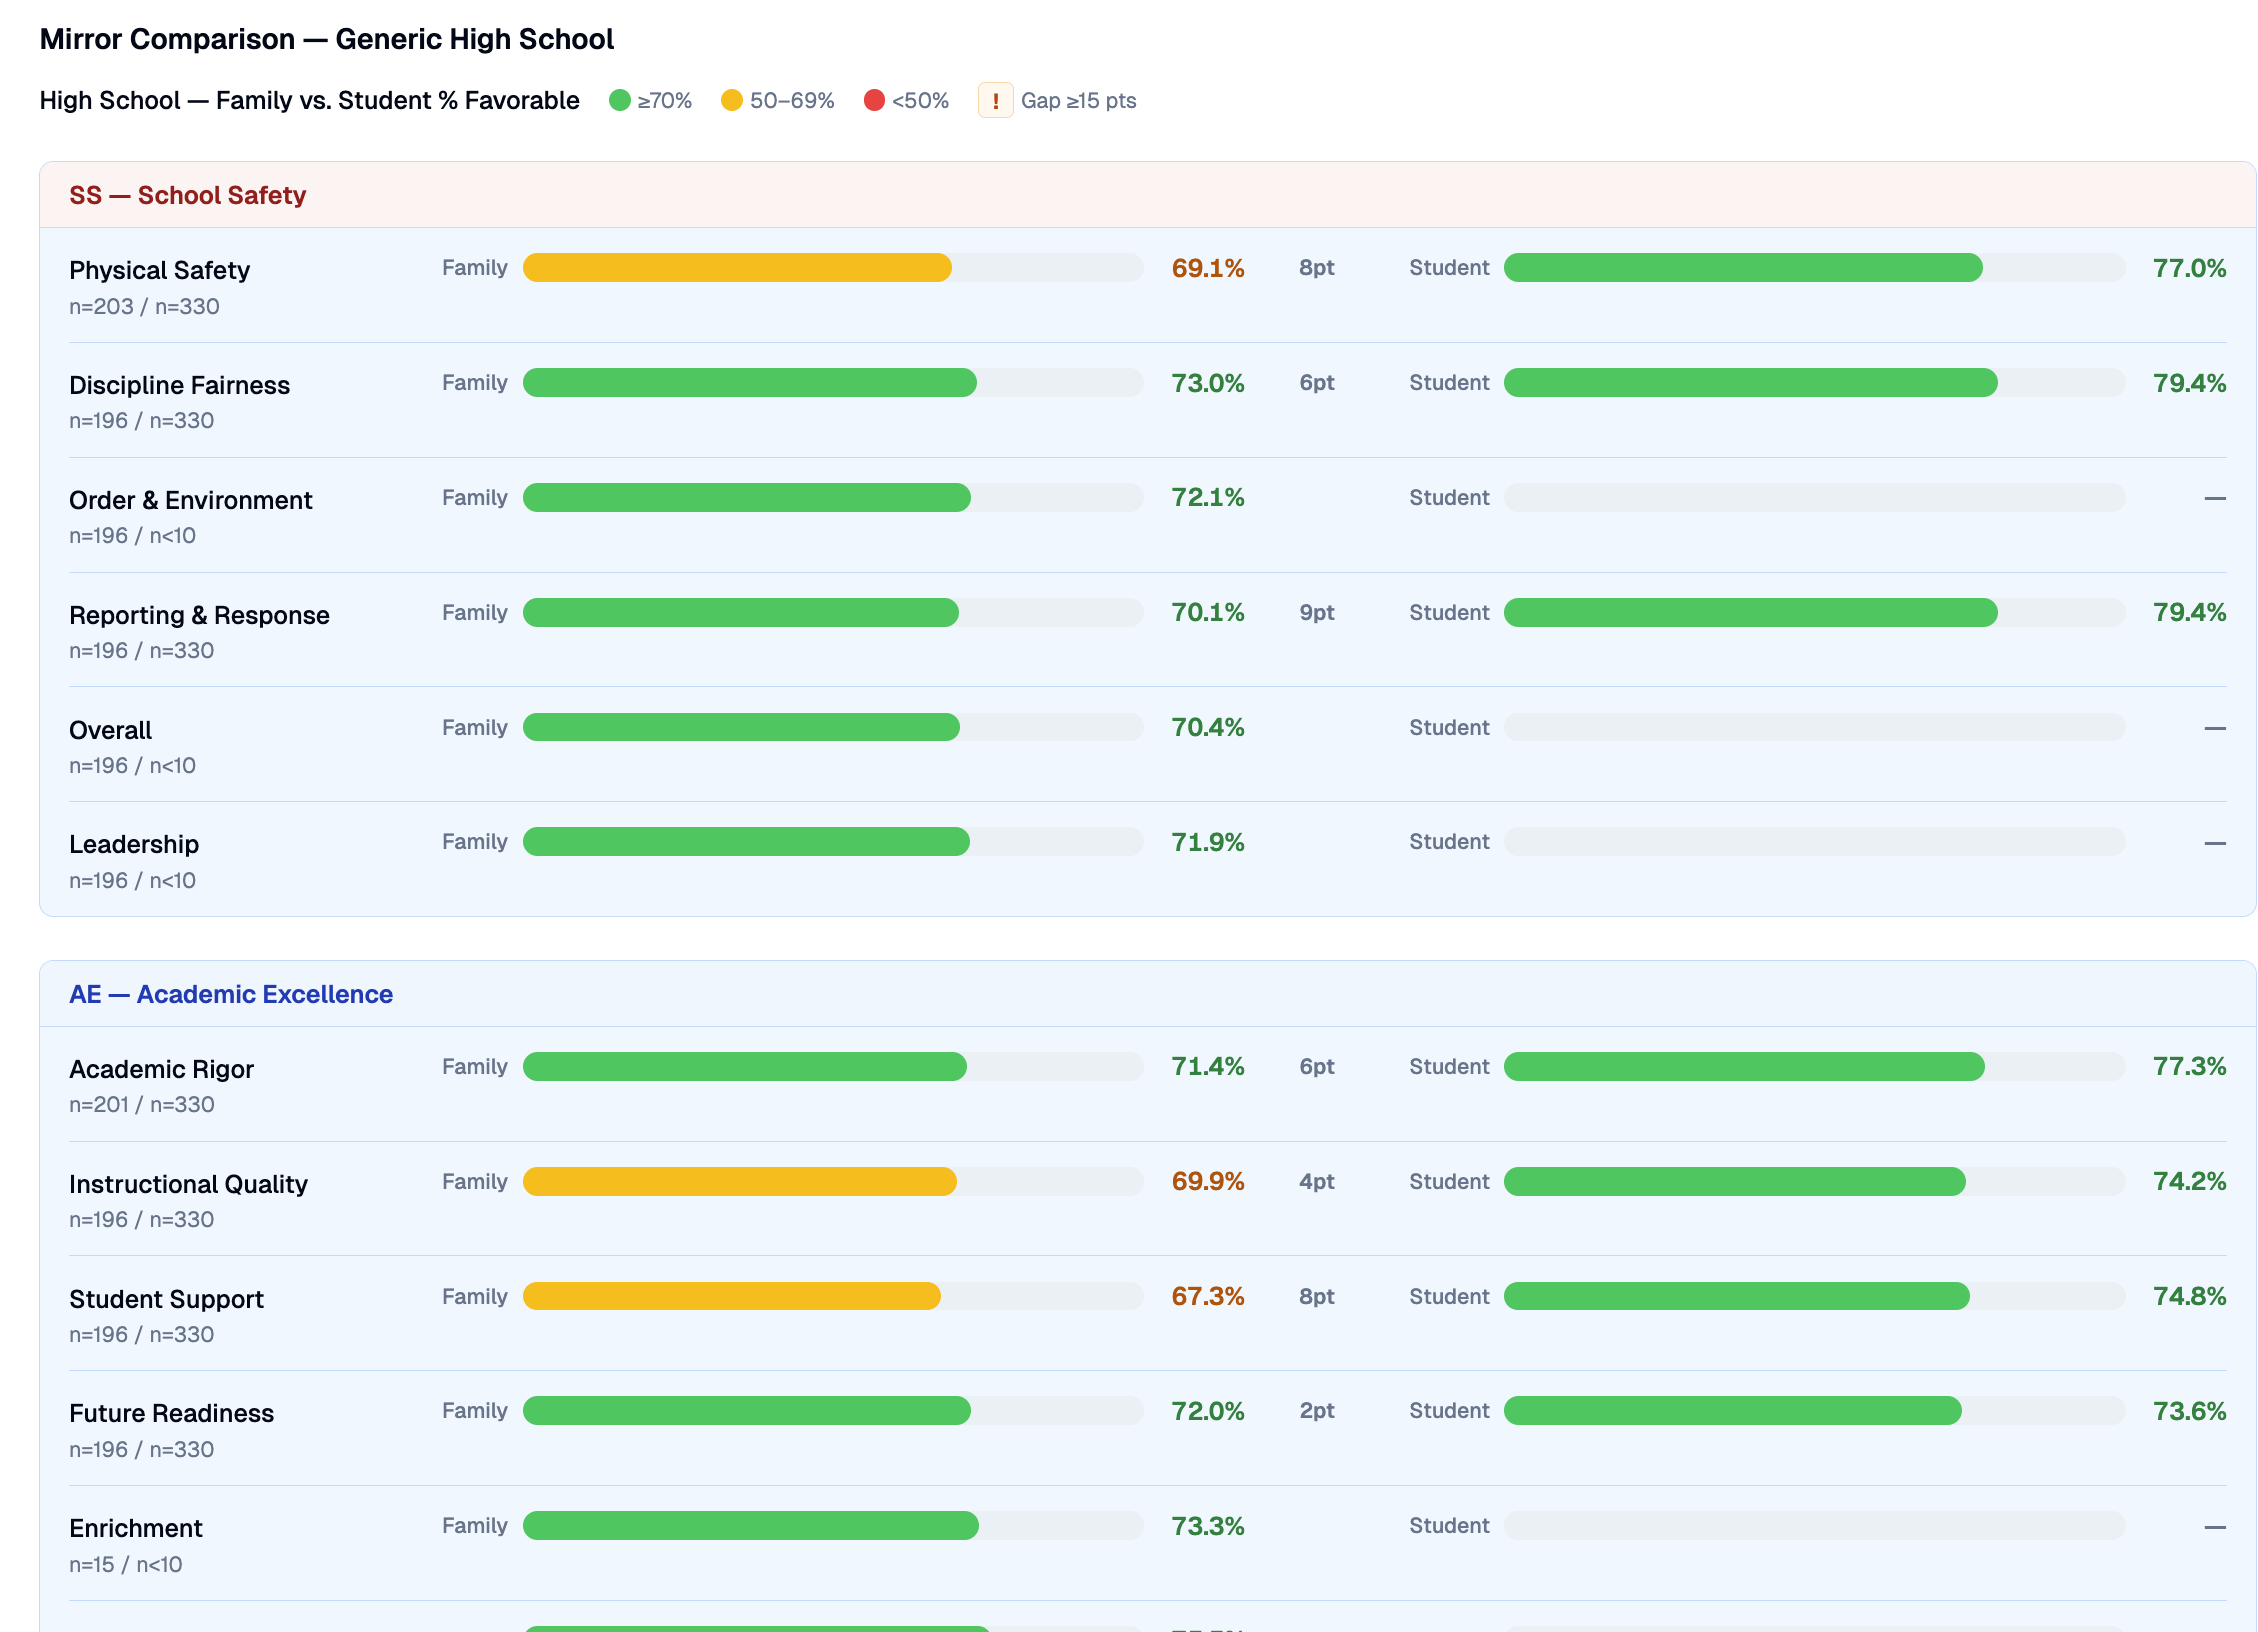
The mirror comparison places family and student perception of the same campus side-by-side, and flags any gap of 15 points or more, automatically.
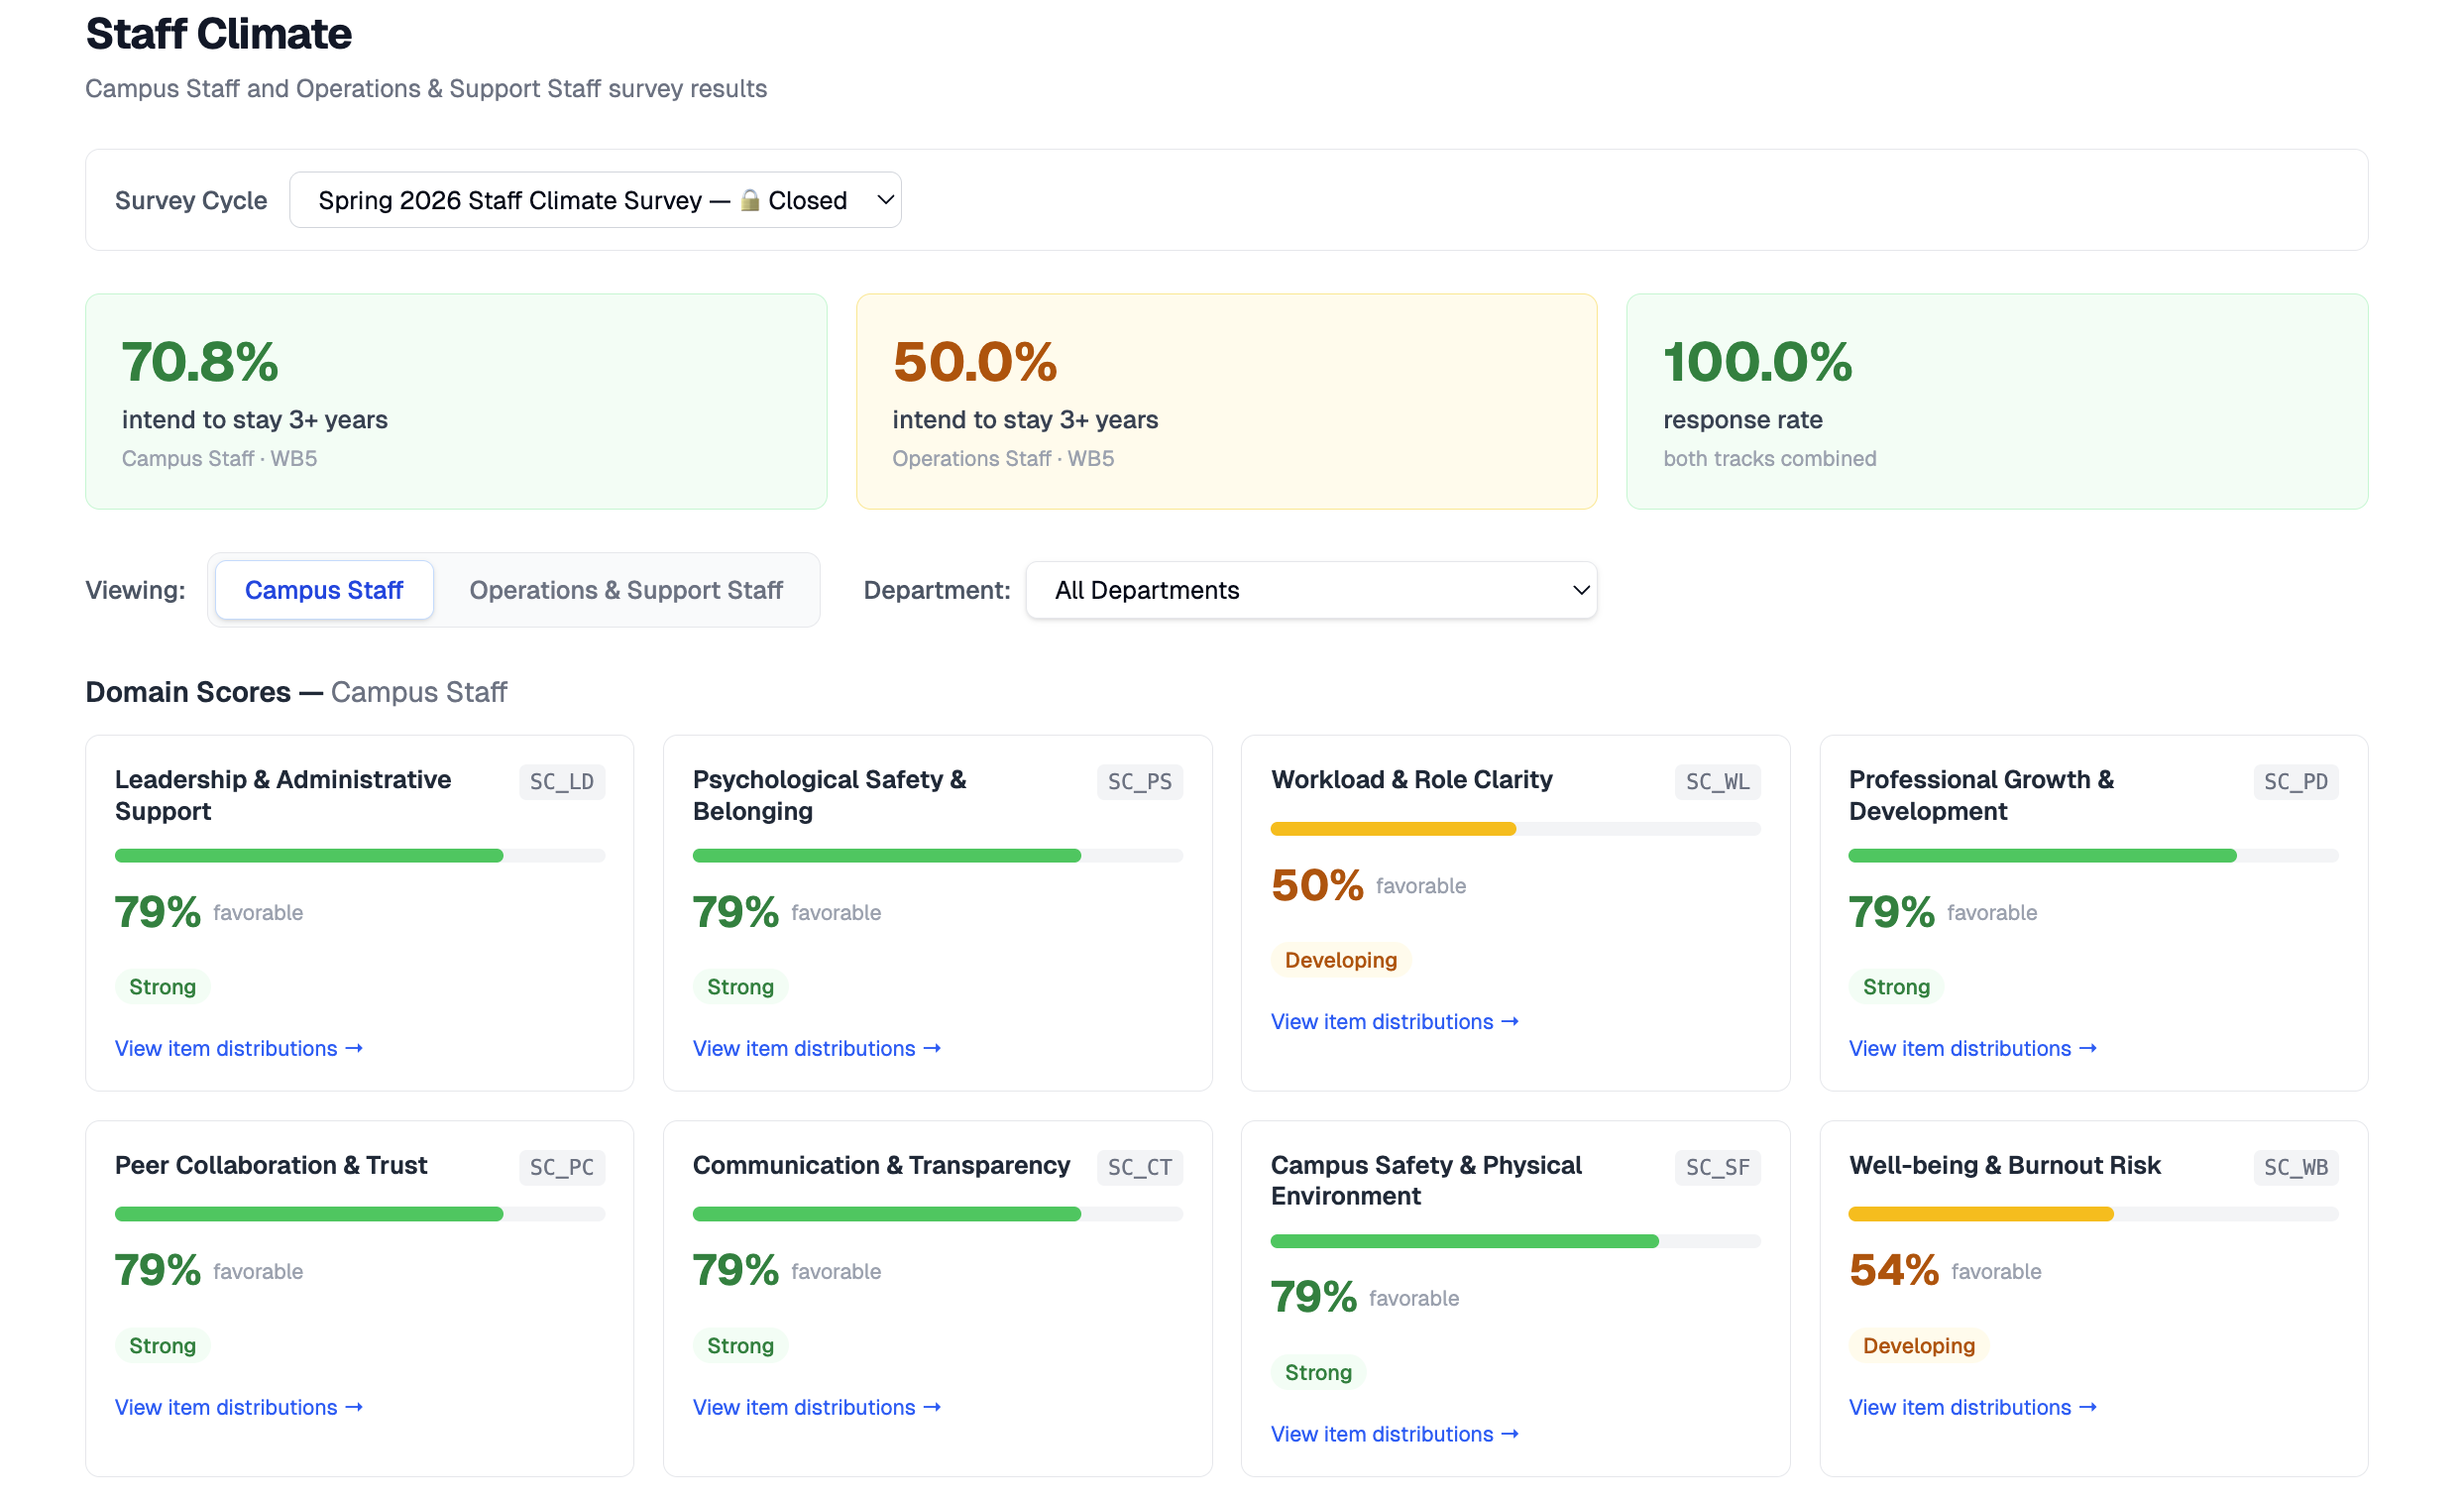
Campus staff and operations & support staff each answer a tuned instrument, rolling up into eight staff-climate domains, plus an early-warning read on who intends to stay.
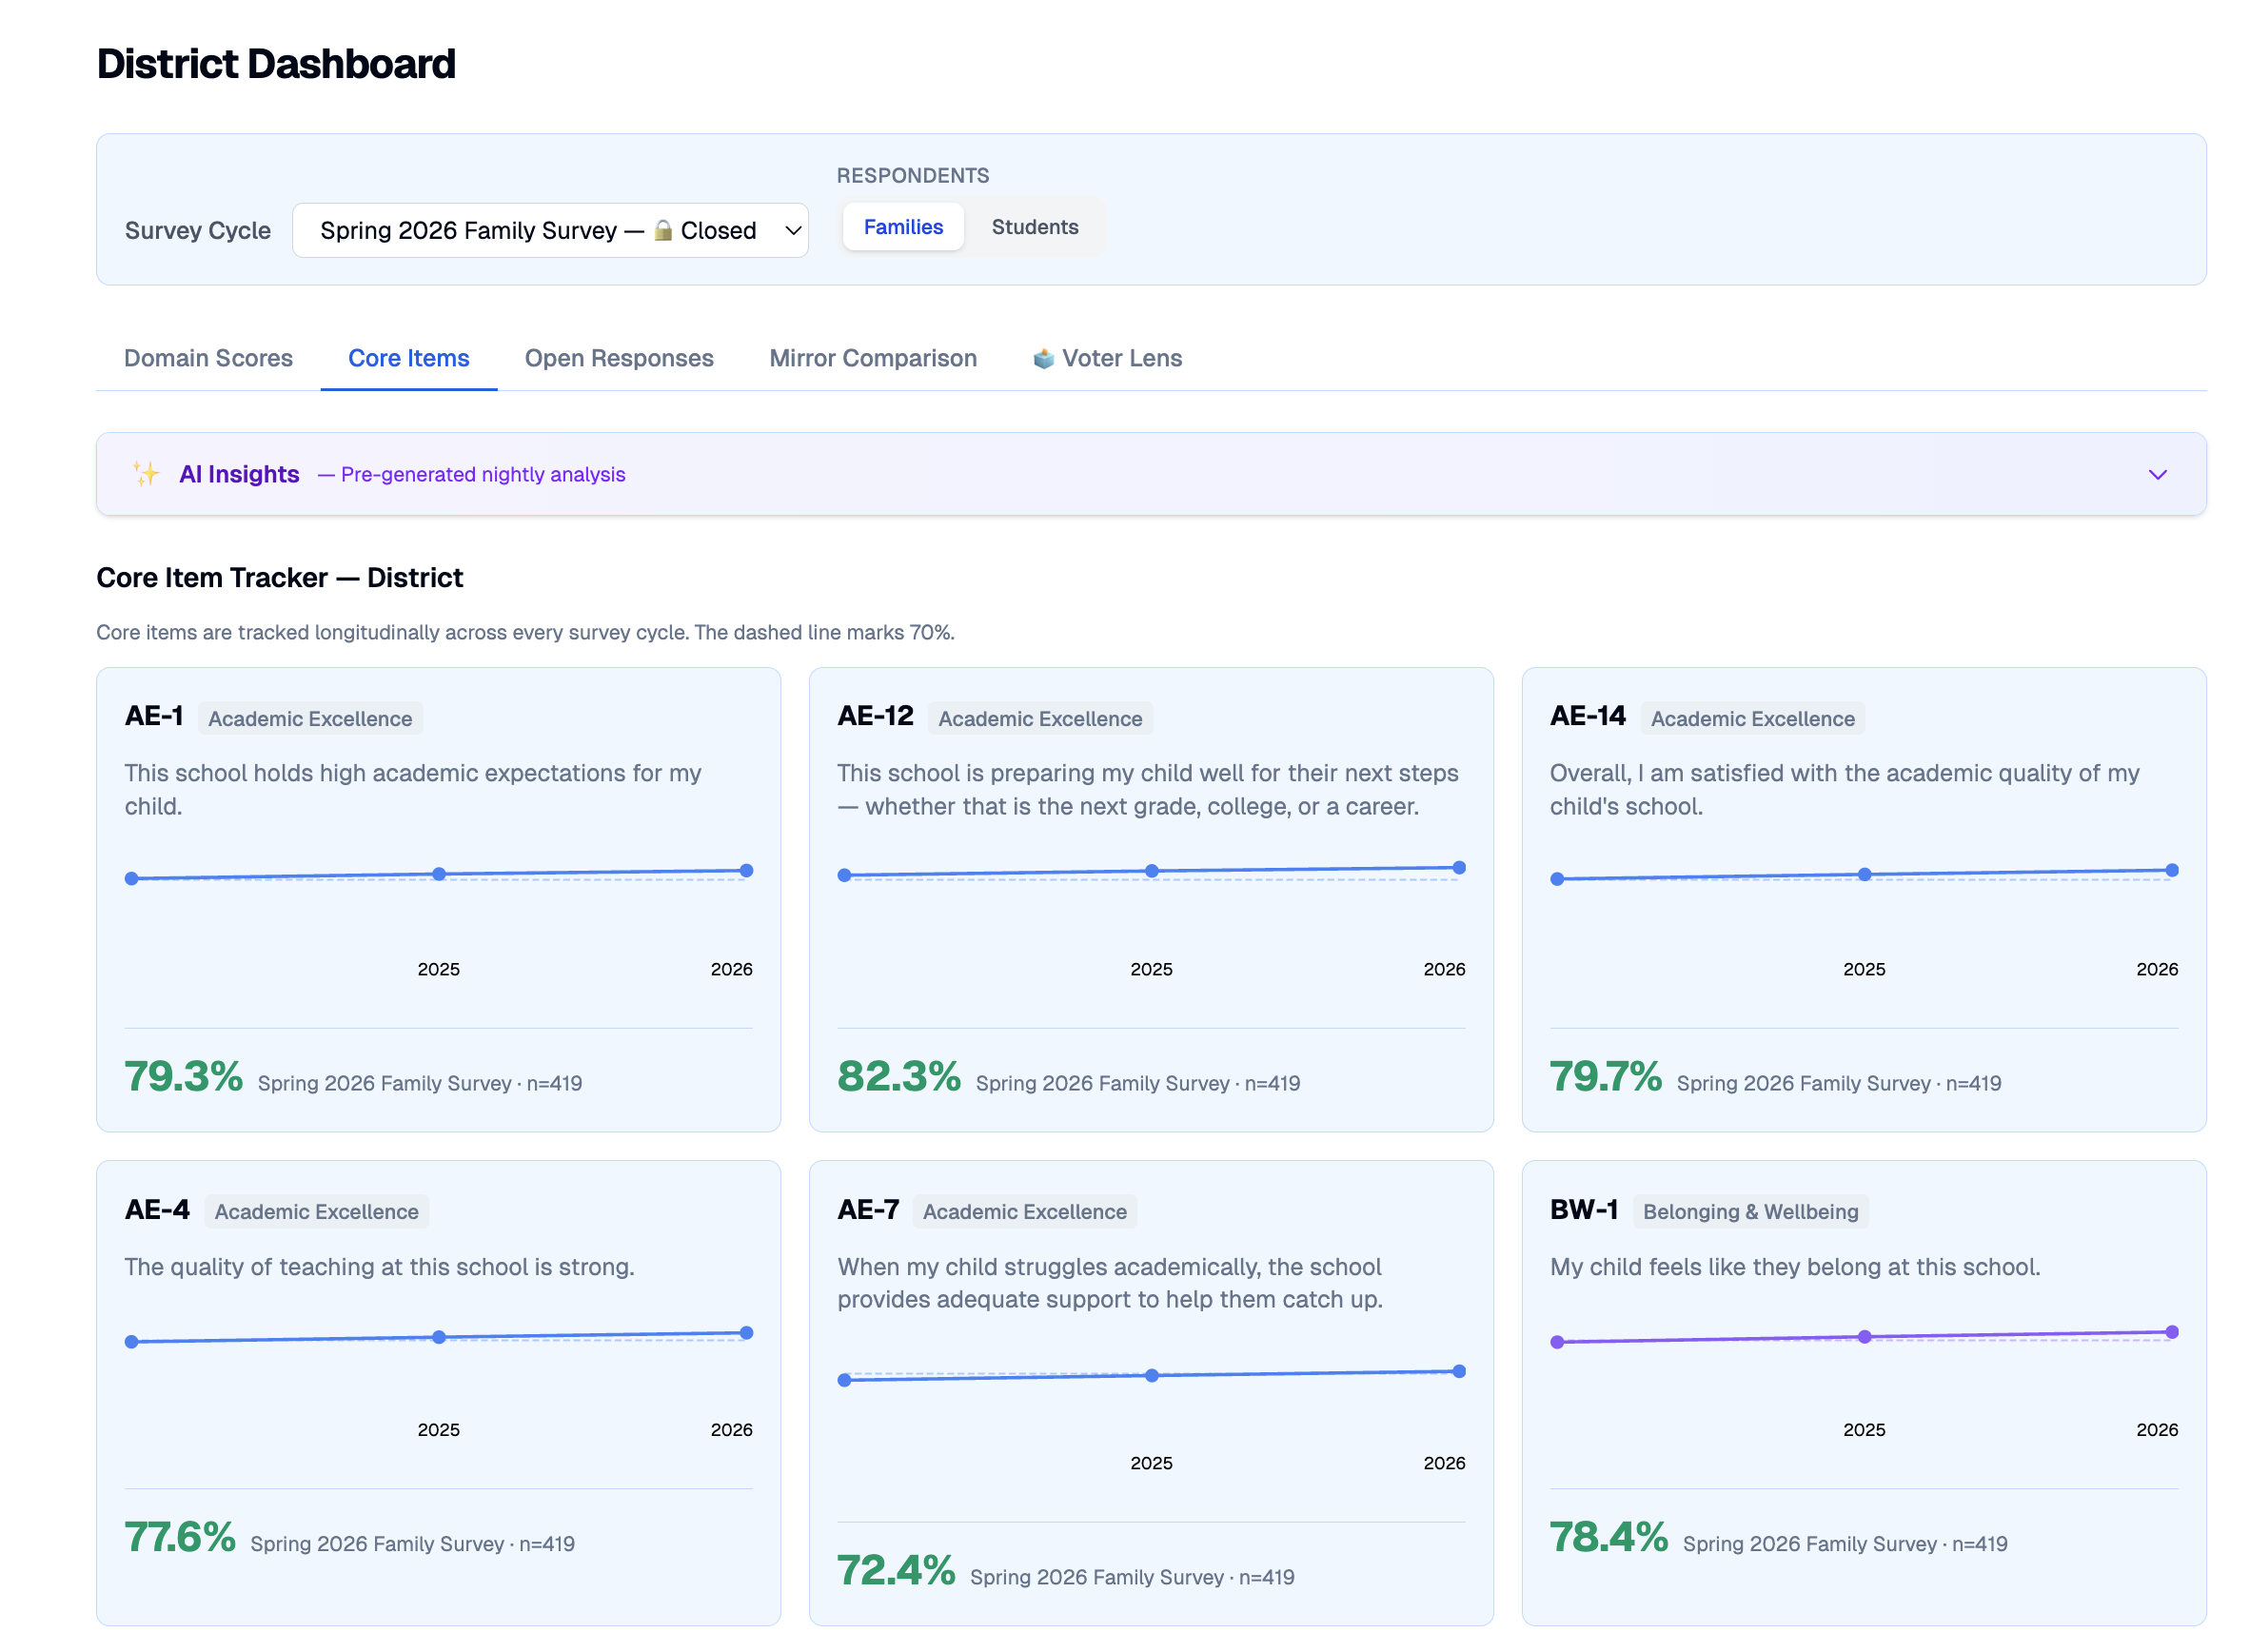
Core items are tracked across every cycle so trends are unmistakable. An integrated AI panel generates a nightly natural-language read: executive summary, strengths, concerns, and prioritized next steps.
Beyond the headline dashboards, the ecosystem covers the operational details that make a district-wide survey program actually run.
An integrated Claude-powered panel writes executive summaries, strengths, and prioritized recommendations every night, at a fraction of a cent per generation.
Every instrument ships bilingual. Translations are first-class schema citizens, so more languages can be added as district demographics evolve.
Drill any domain into per-question, three-segment distributions (positive, neutral, negative) for families, students, or staff by track.
Event-triggered instruments greet new community members and learn from departing ones: for staff at day 1, 30, and 90, and for enrolling and withdrawing families.
Match engaged families against the public voter roll to understand civic participation among your most responsive households.
Generate per-campus and district PDF reports pre-formatted for board night, plus raw disaggregated CSV for research staff.
Student privacy is enforced in the data layer and the API, not bolted onto the interface. Here's what that means in practice.
Student identifiers are never stored alongside answers. Surrogate keys and anonymization are enforced throughout the schema.
Any demographic slice with fewer than ten respondents returns "suppressed," never a score that could re-identify a student or staff member.
District, campus, and site roles are checked server-side. Campus admins receive percentages only; raw counts are stripped before the response leaves the API.
Results disaggregate by race/ethnicity, ELL, special-education, and economic status, with discipline-fairness items always surfaced, never hidden behind an aggregate.