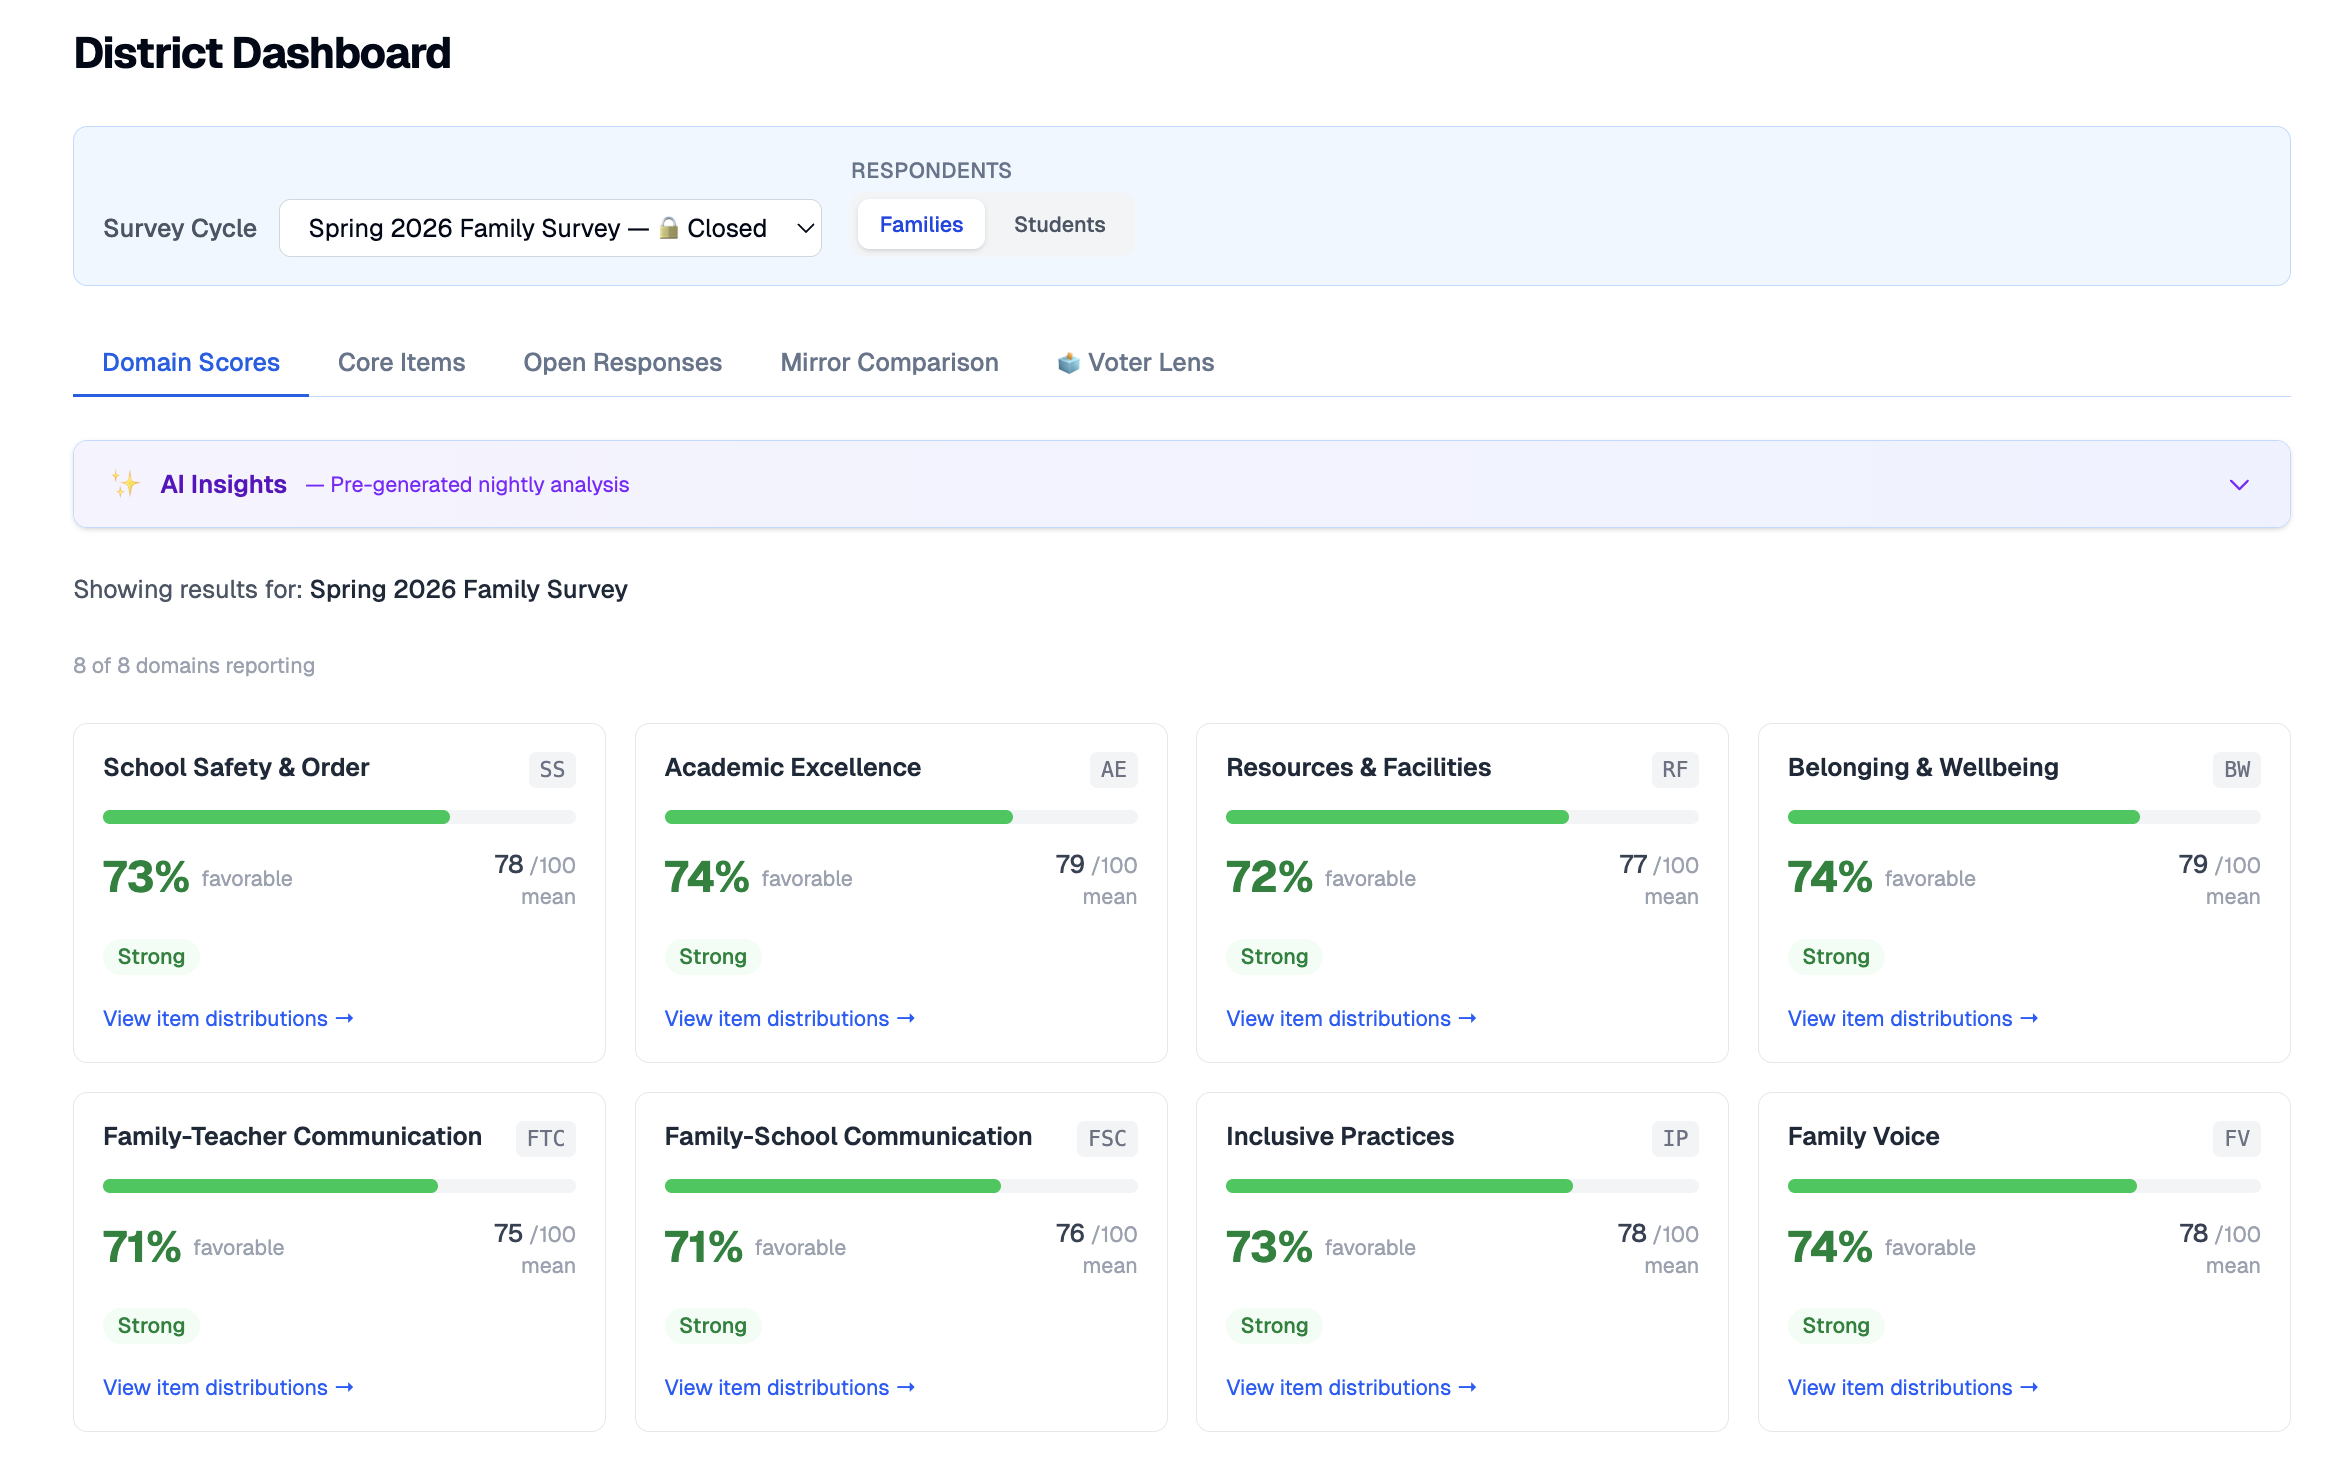
Domain scorecards, core item trends, open-response themes, and campus comparison—updated continuously as responses arrive, and never more than one click deep.
No exports, no waiting on a vendor. Administrators see favorability, mean score, and a strength band for every domain the moment families and students respond. Drill from a domain into item-level distributions in one click.
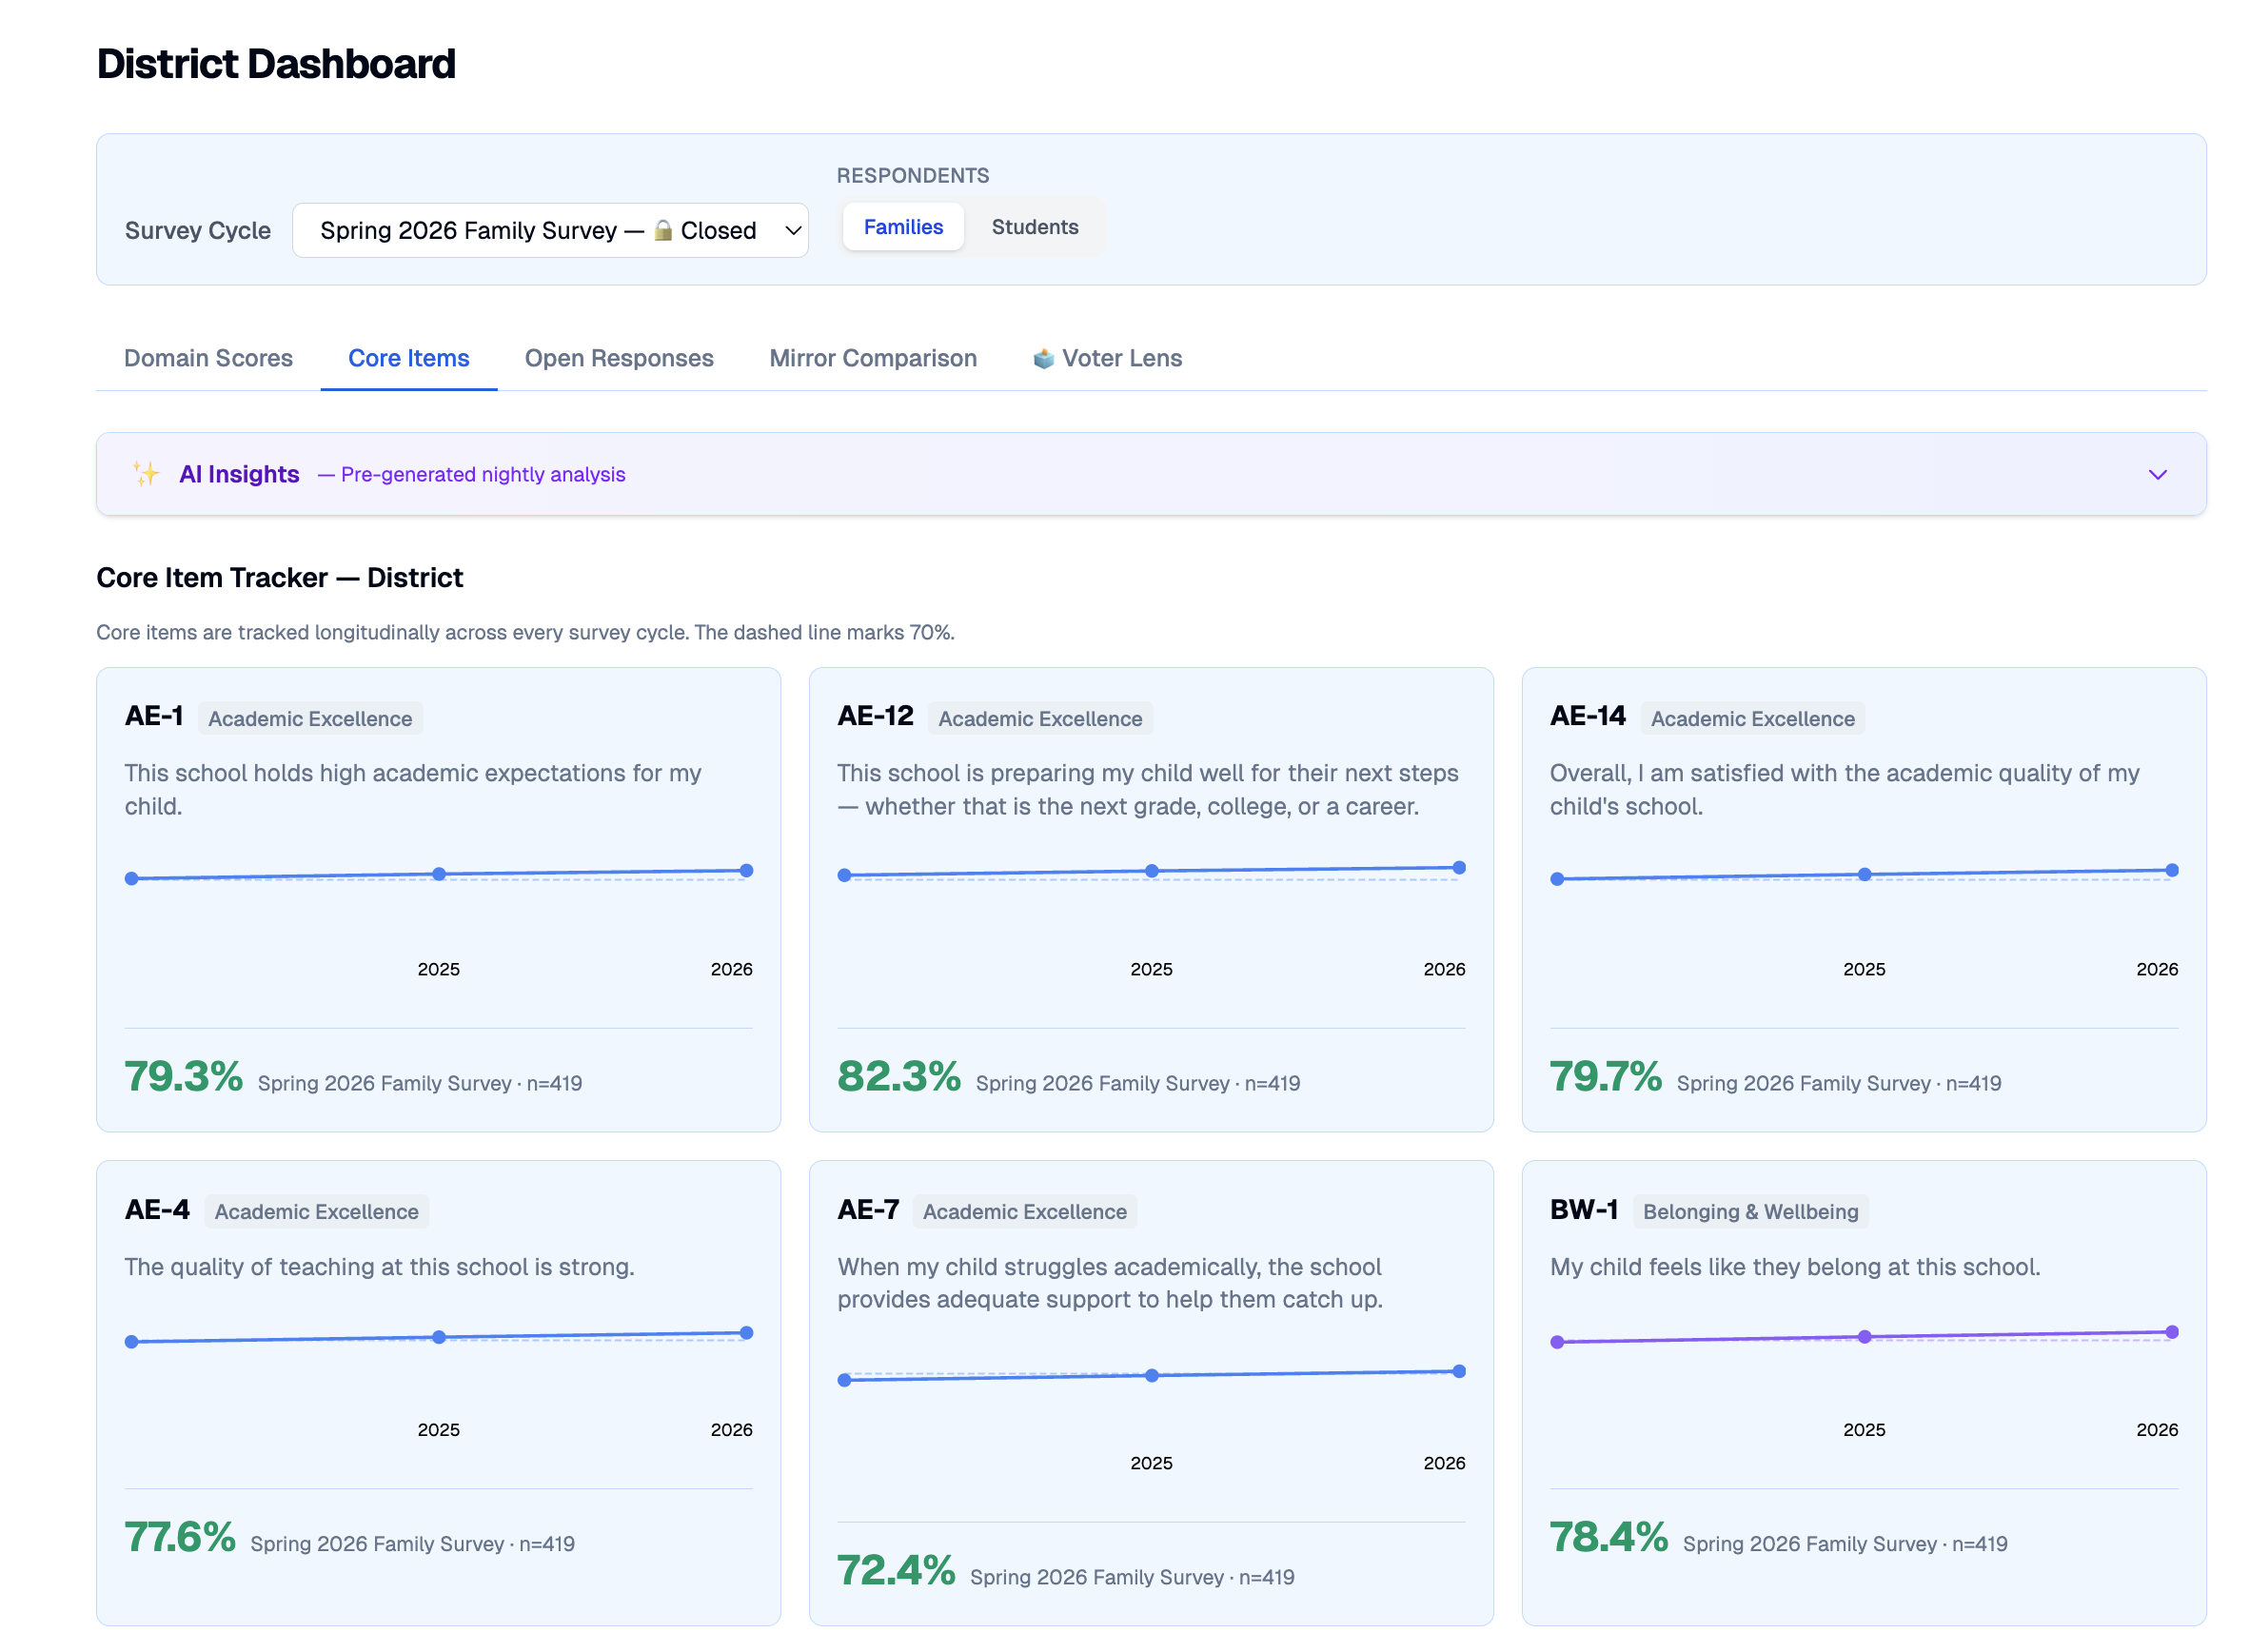
Every response is tied to a survey cycle, so core items build longitudinal trend lines the board can read at a glance. Not just "did the score go up?" but "which item moved, by how much, and over how many cycles?"
Results break down automatically by race/ethnicity, ELL status, special education status, and economic disadvantage. Discipline-fairness items are always surfaced by race—never hidden behind an aggregate. Every PDF and CSV export has small-cell suppression applied before it leaves the system.
Race/ethnicity, ELL, SPED, economic disadvantage—all standard.
Pre-formatted PDF for every campus, plus raw CSV for research staff.
Start with a single campus cycle. We handle the instruments, the languages, and the privacy floor.